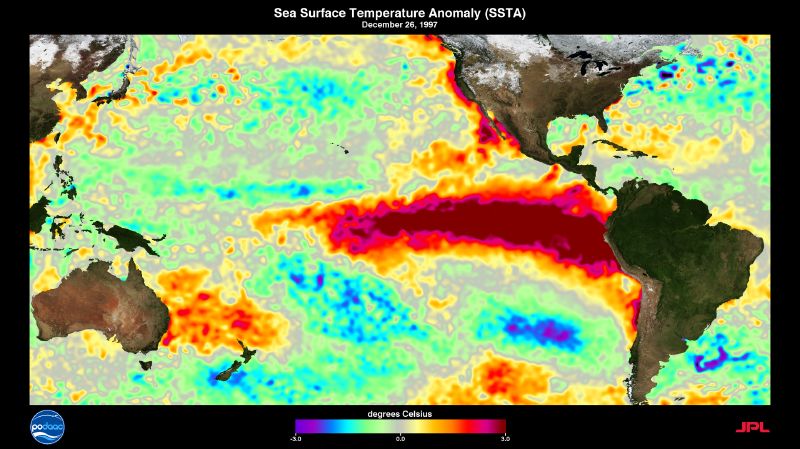
An El Niño’s strength is a temperature reading. Scientists measure how far the surface of the central and eastern tropical Pacific has warmed above its long-term average, and that departure is the standard gauge of each event.
more
The Met Office sets the starting line at 0.5C. Once sea temperatures in the tropical eastern Pacific rise that far above normal, an El Niño is declared.
What the thermometer is measuring
In an ordinary year, trade winds blow west along the equator from South America towards Asia. They heap warm water up on the Asian side, so the sea off Indonesia stands about half a metre higher than the sea off Ecuador. According to NOAA’s Pacific Marine Environmental Laboratory, the water off Asia also runs about 8C warmer than the eastern Pacific, where cold water wells up from below.
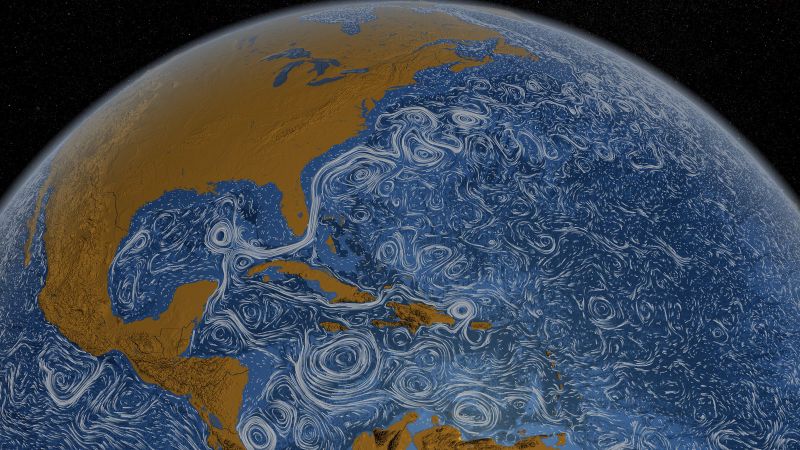
During an El Niño those winds falter, and sometimes reverse into westerlies. NASA describes the result as a great mass of warm water sloshing back towards the Americas. The upwelling of cold water off South America weakens, so the eastern surface warms. That warming is what the gauges pick up.
Where the readings come from
NOAA runs a line of moored buoys across the equatorial Pacific that measure temperature, currents, and winds. They send their data every day, in real time, to forecasters around the world.
The buoys are one tool among several. NASA lists roughly 4,000 floats, gliders, and moorings recording temperature in the top 300 metres of the ocean, plus satellites that track sea height and the winds above it.
How one event is ranked against another
The standard yardstick is the Oceanic Niño Index. Britannica explains that it tracks how far sea temperatures in the east-central Pacific depart from normal. To count as an El Niño, the warming has to stay above 0.5C for at least five overlapping three-month seasons in a row. That rule stops a single warm month from being called an event.
Britannica calls the index the standard means by which each episode is gauged. NOAA’s laboratory names 1982 to 1983 and 1997 to 1998 as two of the largest El Niño events on record. NASA adds 1972 to 1973 and 2015 to 2016 to its list of major events.
None of the four agencies and reference works here ranks any event over a thousand years. Their comparisons run across the events their instruments recorded.
Why the number matters
A strong event reaches far beyond the Pacific. NASA notes that dry parts of Peru, Chile, Mexico, and the south-western United States are often soaked, while the Brazilian Amazon can fall into months of drought. NOAA’s laboratory links El Niño to floods in Peru and to drought in Indonesia and Australia.
It also moves global temperature. El Niño is not caused by climate change, NASA says, but it often produces some of the hottest years on record because so much heat rises from the Pacific into the air.
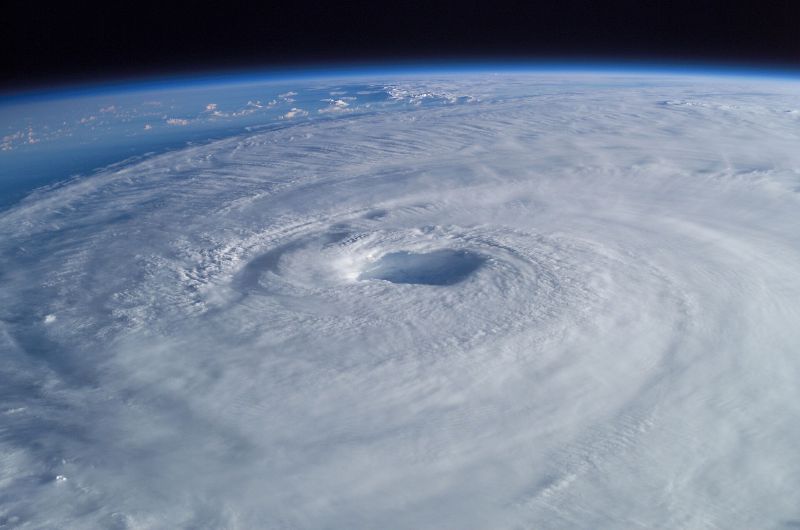
Britain feels it too. The Met Office says El Niño years are one factor that can raise the risk of a colder UK winter. It also notes that El Niño tends to hold back tropical storms in the North Atlantic.
What nobody can yet measure
El Niño returns roughly every two to seven years, alternating irregularly with its cooler sibling, La Niña, and with neutral spells. The buildup can be spotted months in advance. Events typically peak between November and January. What starts one is still unknown. NASA calls the trigger for the shift in Pacific winds and water a scientific mystery.